How Weather Pattern Data Correlates with Regional Sports Wagering Spikes on Outdoor Events in Licensed Apps
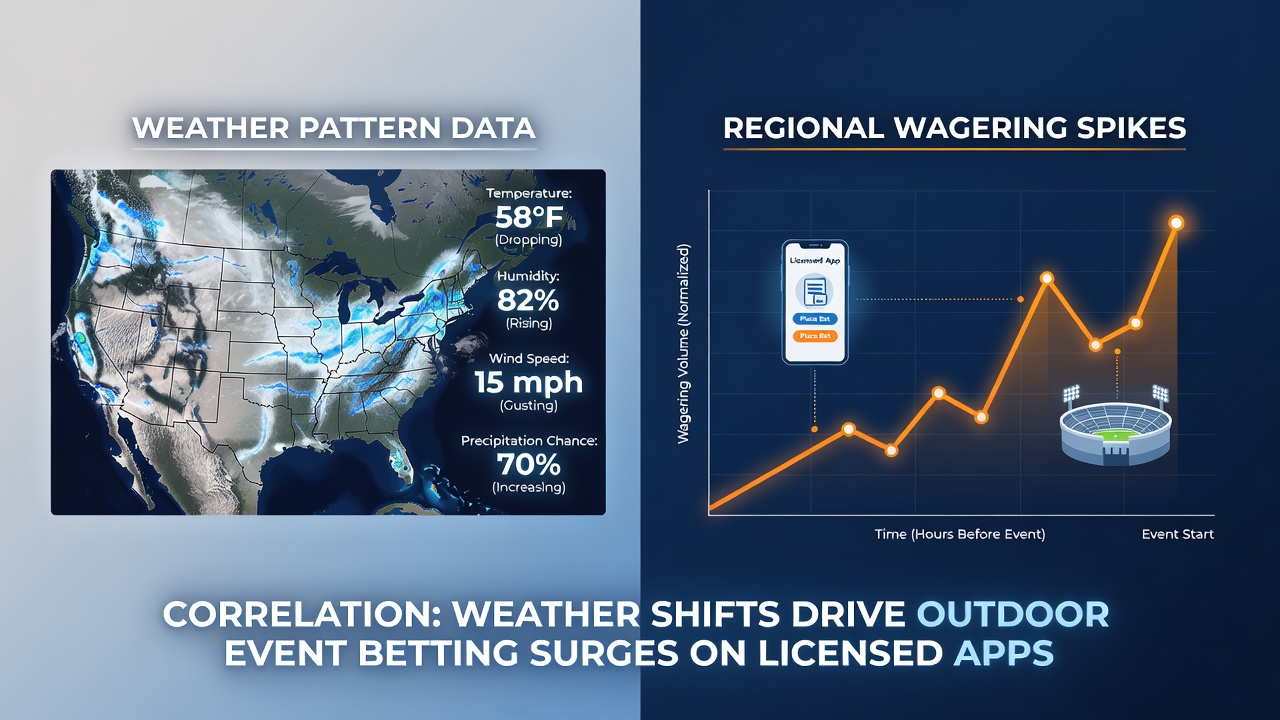
Weather pattern data and regional sports wagering activity intersect in measurable ways when outdoor events take center stage in licensed betting applications. Observers note that temperature shifts, precipitation levels, and wind conditions align with changes in user engagement across platforms that handle bets on baseball, golf, tennis, and similar competitions. Data from multiple jurisdictions shows these patterns emerge most clearly during peak seasons when outdoor schedules dominate the calendar.
Data Collection Methods Behind the Correlations
Licensed apps integrate weather feeds from government meteorological agencies alongside betting volume metrics to identify trends. Researchers track variables such as rainfall probability, humidity ranges, and temperature extremes against hourly wager counts on events like Major League Baseball games or ATP tennis tournaments. Studies from academic institutions in North America and Australia demonstrate that certain thresholds, including sustained winds above 15 miles per hour or temperatures exceeding 90 degrees Fahrenheit, correspond to noticeable increases in betting activity on player props and game totals.
Platforms aggregate anonymized regional data to map these connections without compromising user privacy. Government sources in Canada and the European Union provide standardized weather archives that align with betting records from regulated operators. This approach allows analysts to isolate weather as a variable while accounting for other factors like team performance histories and scheduling changes.
Regional Patterns Across Different Climates
Patterns differ sharply between humid subtropical zones and arid inland areas. In the southeastern United States, afternoon thunderstorms during summer months coincide with elevated wagering on rain-delay outcomes and adjusted player statistics. Data indicates that bettors in these regions place more wagers on live markets when radar shows incoming precipitation cells. Meanwhile, in drier climates such as parts of Australia, extreme heat warnings correlate with shifts toward over/under bets on total points scored in outdoor matches.
European markets exhibit their own signatures. Coastal regions experience wind-driven adjustments in golf tournament betting volumes, while continental areas see temperature drops influence activity on tennis matches played on outdoor courts. July 2026 brought extended heat waves across several European countries that aligned with documented increases in mobile app sessions focused on outdoor events.
Key Weather Variables and Betting Volume Shifts
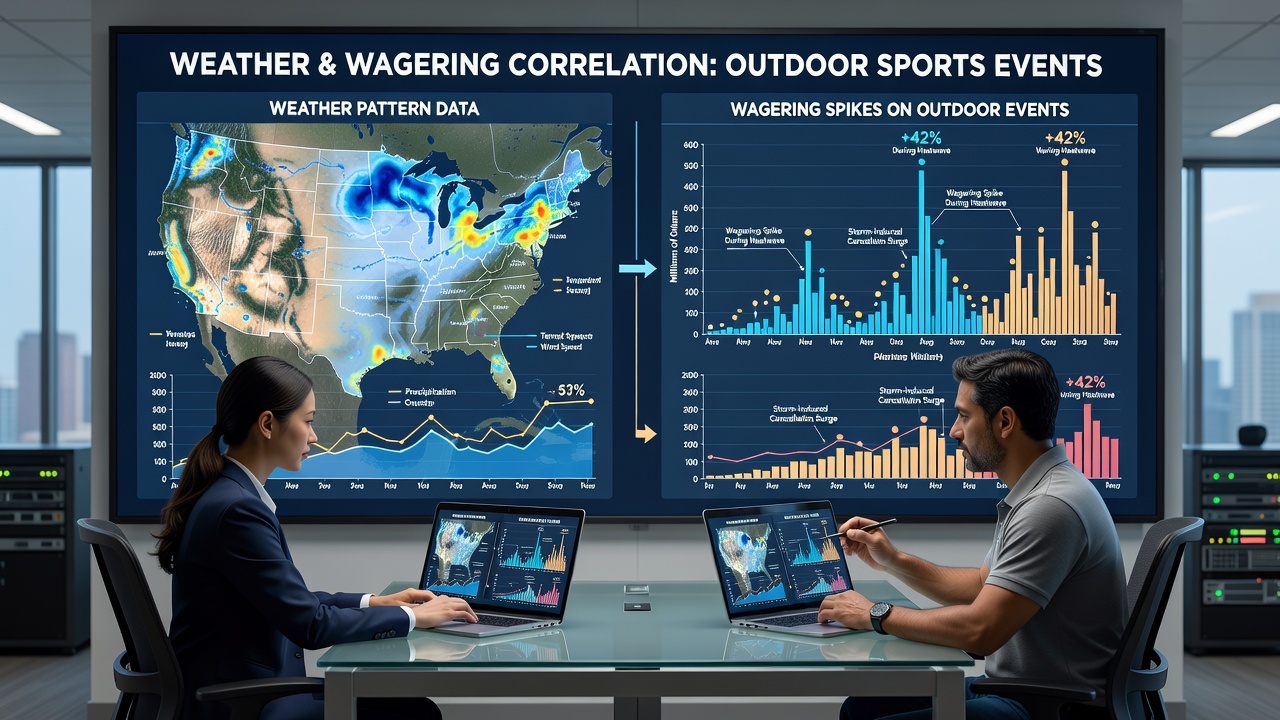
Precipitation remains the strongest single correlate. Licensed platforms report that forecasts calling for steady rain over three hours or more often precede spikes in wagers on game postponements or revised lineups. Temperature swings produce secondary effects, particularly when overnight lows fall below seasonal averages and affect player endurance metrics. Wind speed data from the National Oceanic and Atmospheric Administration shows direct ties to betting adjustments in baseball and golf, where crosswinds alter ball trajectory expectations.
Humidity levels add another layer. High dew points in tropical regions link to increased activity around hydration-related props and fatigue-influenced outcomes. Analysts combine these elements into composite indices that licensed apps use to flag potential volume surges hours in advance.
Examples from Licensed Markets in 2026
During July 2026, several North American operators recorded elevated handle on MLB day games when heat advisories covered multiple stadiums. Similar patterns appeared in Australian markets during the same period, where winter storms disrupted outdoor cricket and prompted shifts toward alternative wagers. Regulatory reports from state gaming commissions in the United States and provincial authorities in Canada confirm that weather-integrated analytics help platforms manage liquidity during these windows.
One analysis of tournament data from the Australian Open qualifiers revealed that sudden temperature drops aligned with changes in live betting ratios on match durations. Platforms adjusted promotional timing to match these shifts while staying within regulatory guidelines.
Conclusion
Weather pattern integration with regional sports wagering data continues to evolve through improved forecasting tools and expanded licensed app coverage. Government meteorological records combined with operator analytics provide consistent evidence of correlations across diverse climates and event types. These connections support more precise operational planning without altering the fundamental structure of regulated betting markets.